The modest rise in unemployment hides a much grimmer picture
In today’s post, Matt Cowgill and Brendan Coates from the Grattan Institute explain why Labour Force data released by the Australian Bureau of Statistics on 14 May 2020 doesn’t capture the full impact of COVID-19 on jobs. This post is republished from the Grattan blog.
New ABS figures released on 14 May 2020 confirm that COVID-19 has thrown a lot of Australians out of work.
About 900,000 people who were employed in the first half of March no longer had a job in the first half of April.[1] A further 750,000 people still had a job, but didn’t work any hours in April. It’s likely that the Federal Government’s JobKeeper program helped soften the blow to employment in Australia. The number of people who still had a job despite not doing any work would probably have been much higher if the wage subsidy had not been in place.
On top of the 900,000 people who lost their jobs and the 750,000 who still had jobs but didn’t do any work, another million people did some work but had fewer hours than usual. All up, that makes about 2.7 million people out of a labour force of 13.7 million people[2] who lost their job or lost hours in just a few weeks.
This is a shocking fall in the amount of work being performed in Australia. In March, Australians worked an average of 86 hours per adult – that’s 86 hours for every adult, whether they’re in work or not. In April, that figure fell to 78 hours per adult.[3] That drop in hours worked – 9 per cent in a single month –is the biggest ever recorded, and it takes the average number of hours worked to its lowest level on record.
The rise in unemployment doesn’t tell the full story
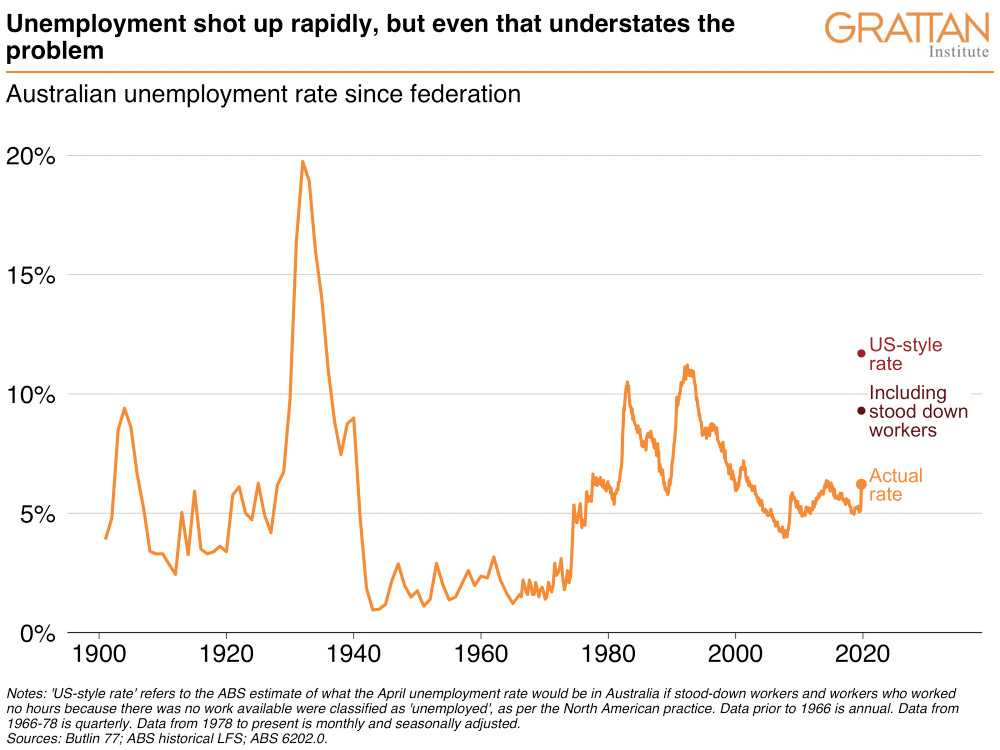
Despite this, the rise in unemployment was surprisingly modest. The number of people with jobs fell by about 600,000,[4] but the number of unemployed people rose by ‘only’ 104,500. This dragged the unemployment rate up from 5.2 to 6.2 per cent – the largest one-month rise ever recorded in Australia,[5] but not the Great Depression-level rate that has been recorded in the US.
To understand why unemployment in Australia didn’t rise more, we need to get into the details of how the ABS defines ‘unemployment’. The unemployment figures don’t refer to the number of people claiming government benefits – the overlap between people receiving money from Centrelink and considered by the ABS to be unemployed is surprisingly small. Australia now has 1.6 million people receiving the JobSeeker Allowance, but only 823,000 considered by the ABS to be unemployed. The ABS arrives at its figure by conducting a big survey – typically interviewing more than 50,000 Australians each month – and asking them a series of questions about their work status.
Like most other countries, Australia follows the measurement framework set out by the UN’s International Labour Organization. In this framework, a person who is temporarily away from work – such as if they have been ‘stood down’ – will still be classified as having a job if they’ve worked at all in the past four weeks, or if they’ve received some pay from their boss (such as through the JobKeeper program). This helps explain why 750,000 people who didn’t do any work in April were still considered to be ‘employed’.
Once the ABS has decided that a person isn’t ‘employed’, it has to decide if they’re ‘unemployed’ or ‘not in the labour force’. A person without a job is only considered to be ‘unemployed’ if they’re actively looking for work, and willing and able to start work if a job becomes available. If they don’t meet these criteria, they’ll be considered ‘not in the labour force’ – they won’t count towards the unemployment rate. The flow chart below — from our recent Grattan working paper Shutdown — gives an overview of how people are classified in the labour force statistics.
A lot of Australians left the labour force in April. The number of people with a job fell 594,000, but the number of unemployed people rose by only 104,000. About 489,000 people left the labour force entirely – they didn’t satisfy the ABS test of actively looking for work and being ready to start. If all those who lost work had kept looking for it, the unemployment rate would have come in at 9.6 per cent.
It makes sense that a lot of people who lost work wouldn’t meet this test – history shows that when the economy turns down, a lot of people give up looking for work. In the midst of a global pandemic – when whole industries are shut down, people are fearful of leaving the house, and the Government has temporarily reduced the obligations on people receiving unemployment benefits – it makes sense that even more people than usual would give up looking for a job.
The ABS helpfully provides some figures that illustrate how much the measurement issues matter for the unemployment rate in Australia. If people who worked no hours and told the ABS they were ‘stood down’ had been counted as unemployed, Australia’s unemployment rate in April would have been 9.3 per cent. If we add
in other people who worked zero hours because there was not enough work available, the rate would have been 11.7 per cent. This definition of unemployment is more consistent with the way they measure it in the US (where unemployment hit 14.7 per cent in April) and Canada (13 per cent).[6]
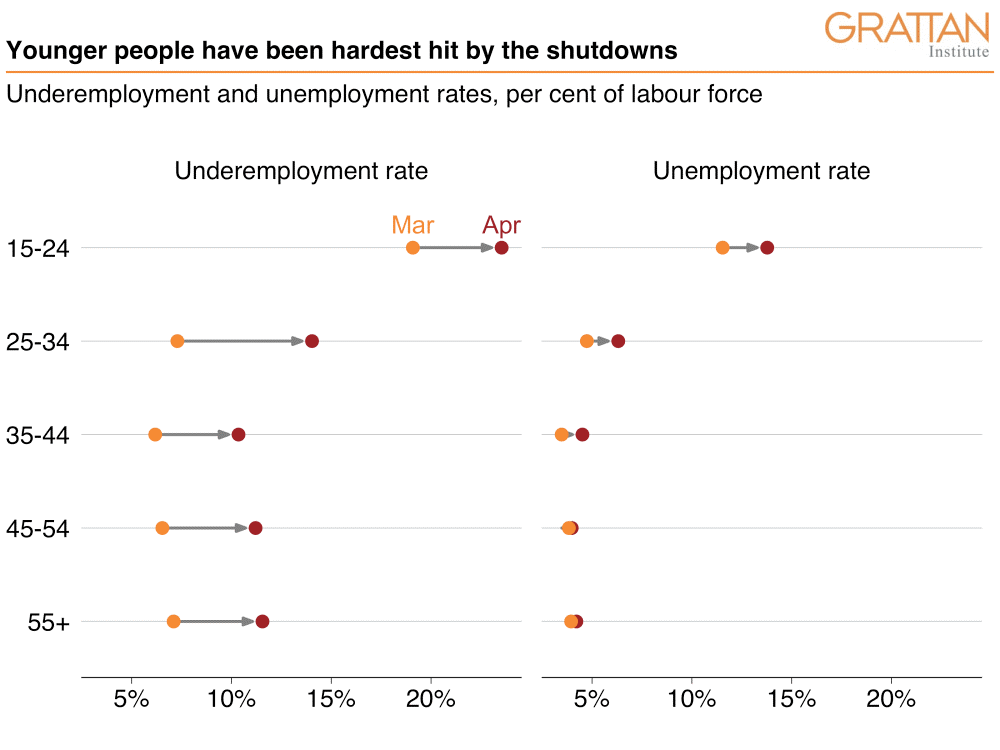
The unemployment rate understates just how hard COVID-19 has hit the Australian labour market. This is confirmed by looking at the number of people who were underemployed – they had a job, but wanted more hours. The proportion of the labour force who are underemployed rose from 8.8 per cent in March – already pretty high – to a staggering 13.7 per cent in April, a 4.9 percentage point rise. Adding the underemployed to the unemployed shows an underutilisation rate of 19.9 per cent – that is, a fifth of the labour force either didn’t have a job, or wanted more hours. And that doesn’t factor in the people who didn’t have a job but gave up looking for one.
Younger workers have been hit hardest
People of all ages were more likely to be unemployed or underemployed in April than in March, but COVID-19 continues to hit younger people hardest. Youth unemployment rose to 13.8 per cent in April, or double the headline unemployment rate. With more than 20 per cent of Australians aged 15-24 also underemployed, more than one-third of younger Australians are without paid work or working fewer hours than they would like to. In contrast, unemployment among Australians aged 45-plus barely moved between March and April.
The shock to the labour market is not unexpected. Governments have – quite sensibly – closed down whole swathes of the economy to limit the spread of the virus. But the size of the hit to jobs is still breathtaking, and it’s disguised by the unemployment rate. Australia’s labour market won’t be in a healthy state again until the number of hours worked per person climbs back to its pre-crisis levels, and underemployment falls to merely bad rather than horrific levels.
Footnotes:
[1] About 300,000 people who were not employed in March moved into employment in April, so the net change in employment was about 600,000.
[2] This is the March figure; the labour force fell to 13.2 million in April.
[3] By dividing the number of hours worked by the total population, this measure is not affected by the classification of people as in the labour force or not. This makes it a clearer guide to labour market conditions.
[4] This is the net figure – about 900,000 people moved out of employment, but 300,000 people moved into employment.
[5] The monthly labour force series goes back to 1978.
[6] The difference in the treatment of ‘stood down’ or ‘furloughed’ workers matters to an unusually large extent at the moment due to the nature of the COVID-19 shock.
Content moderator: Sue Olney


